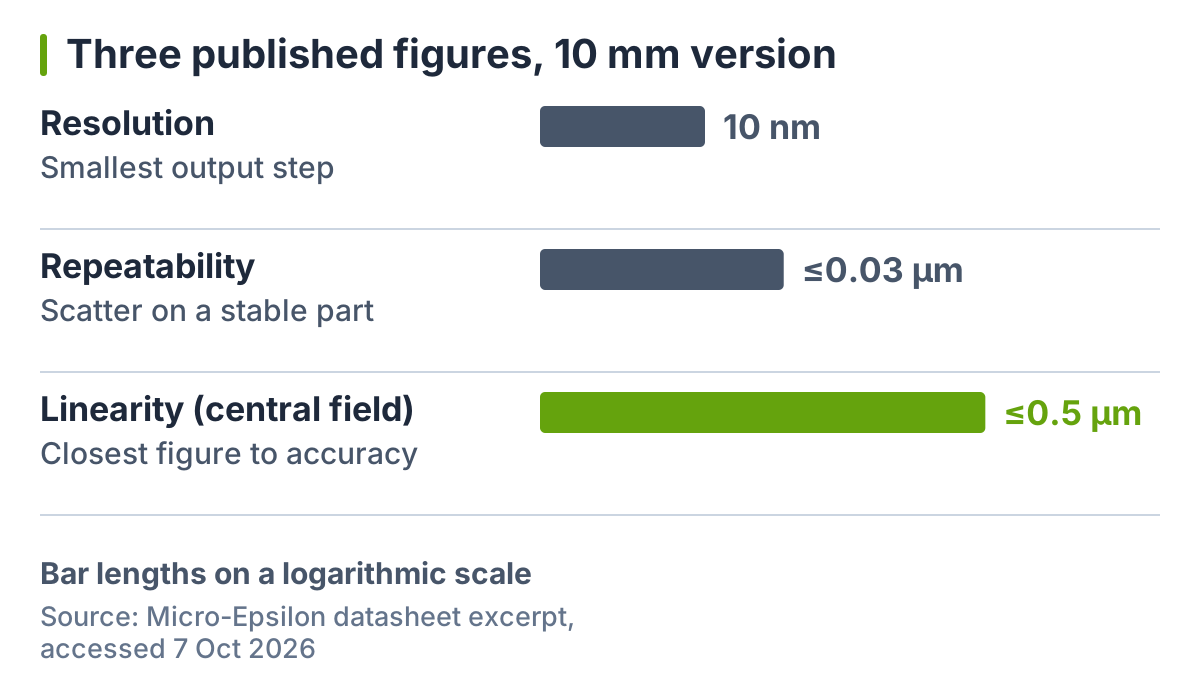
Reading the 10 nm figure as accuracy leads to the wrong tolerance budget. The profileGAUGE C.ODC datasheet rates linearity at ≤0.5 µm for the 10 mm version and ≤1 µm for the 40 mm version, so the published figure closest to “accuracy” is 50 to 100 times larger than the resolution quoted in the launch coverage; the ratio compares two specifications, not measured accuracy.
If you are judging whether Micro-Epsilon’s two-axis optical gauge fits a wire, fibre or precision-tube line, start your error budget from linearity, not resolution. The datasheet excerpt on the manufacturer’s US product page (downloaded 2026-10-07) adds linearity: ≤0.5 µm for the 10 mm model and ≤1 µm for the 40 mm model with a 2 mm test pin at 150 mm in the central field. Both linearity and repeatability are manufacturer figures at 95% confidence, averaging 1,024 diameter values over 5 minutes, temperature-stabilised, after a 45-minute warm-up. The ≤0.03 µm repeatability applies to the 10 mm model only; the 40 mm model is rated ≤0.1 µm.
This is a compilation of public manufacturer documents and one trade-press report, not a test. The site is independent of the vendors it covers; see about this site.
What did Micro-Epsilon announce, and what does the datasheet add?
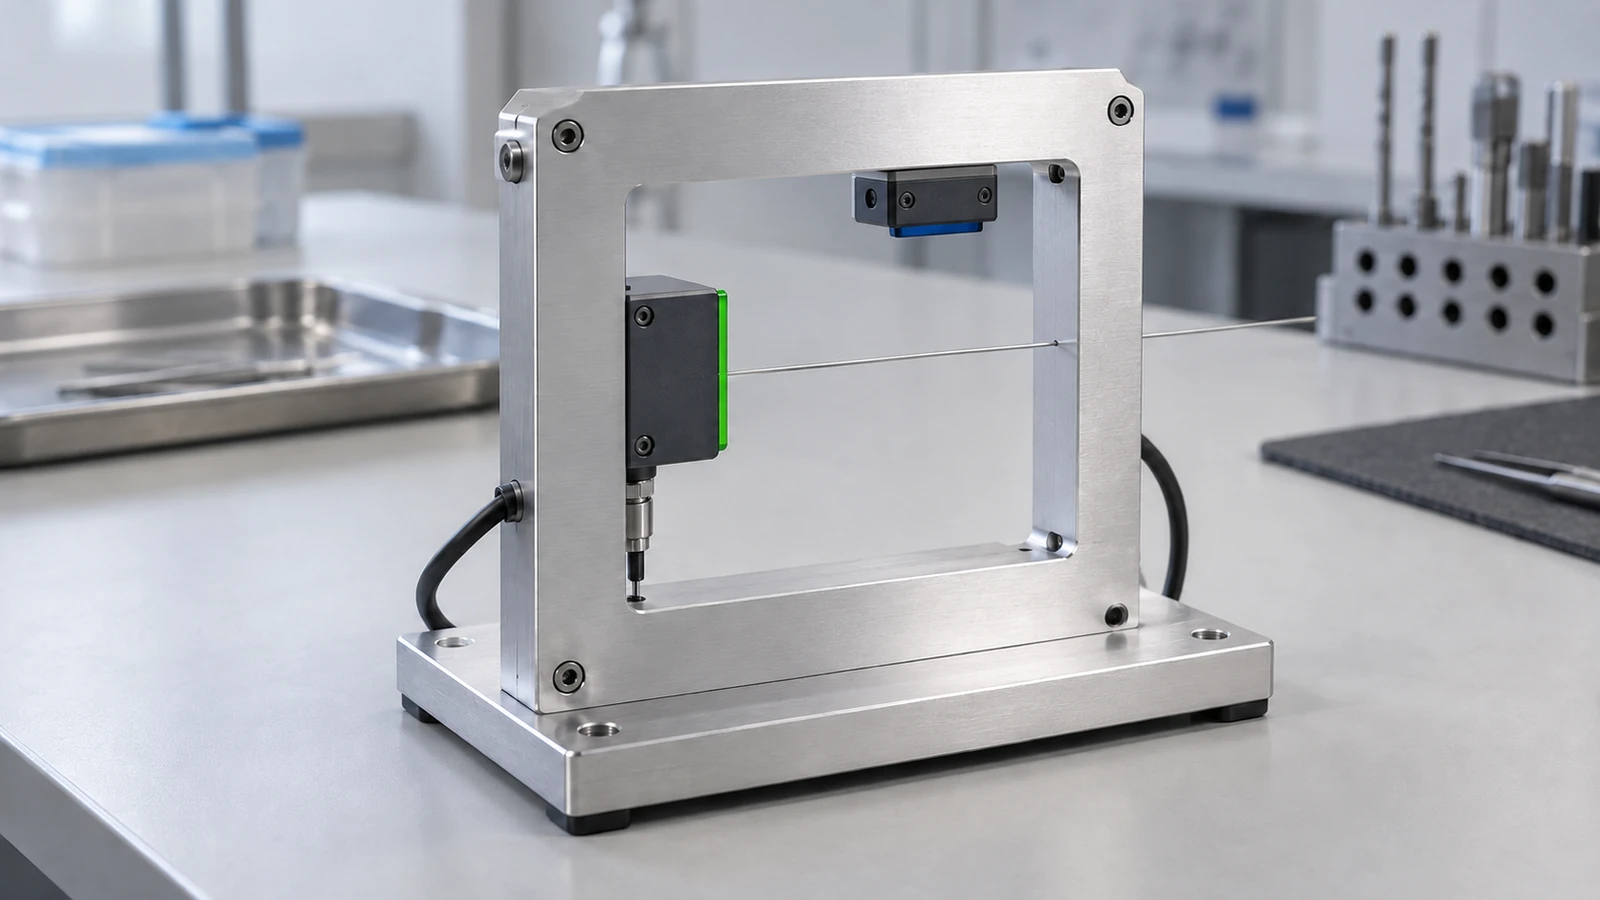
Micro-Epsilon announced a ready-built frame holding two of its optoCONTROL 2700 optical micrometers at right angles, sold as the profileGAUGE C.ODC for inline diameter, contour and position measurement of fine wires and small round parts. The trade-press report appeared on 6 October 2026; the datasheet excerpt carries the full specification table.
| Event | Date | Source | Nature of source |
|---|---|---|---|
| optoCONTROL catalog PDF with ODC2700 applications | File created 21 Sep 2026 | Micro-Epsilon catalog | Manufacturer document |
| profileGAUGE datasheet excerpt with C.ODC table | File created 29 Sep 2026 | Micro-Epsilon datasheet | Manufacturer document |
| Launch report: “Meet profileGAUGE C.ODC” | 6 Oct 2026 | Instrumentation Monthly | Trade press rewriting the vendor release |
| Product page with US sales representatives | Read 7 Oct 2026 | Micro-Epsilon US site | Manufacturer page |
The datasheet lists six models: C.ODC-10/2, -10/2.PG and -10/2.PGA built on the ODC2700-10, and C.ODC-40/2, -40/2.PG and -40/2.PGA built on the ODC2700-40. “PG” adds a protective glass attachment; “PGA” adds protective glass and air purge. The C.ODC frame weighs 26 kg and uses a 508 nm LED light source, not a laser.
Takeaway: Treat 6 October 2026 as the press date, not a confirmed first-sale date, and work from the datasheet table.
Resolution, repeatability, linearity: which figure is the accuracy?
Linearity is the published figure closest to accuracy and the right starting input for an error budget. Resolution is the smallest step the digital output shows; repeatability is the scatter of repeated readings of the same part; linearity is the deviation from the true dimension of a test pin across a measuring field. None of the three is a promise of in-line accuracy on your product.
| Figure | 10 mm version | 40 mm version | What it tells you | Datasheet condition |
|---|---|---|---|---|
| Resolution | 10 nm | 10 nm | Smallest output step | At the digital interface |
| Repeatability | ≤0.03 µm | ≤0.1 µm | Scatter on a stable part | Footnote [6] (below) |
| Linearity, central field | ≤0.5 µm (field 1, Z = ±0.5 mm) | ≤1 µm (field 1, Z = ±2.5 mm) | Deviation from a test pin’s true size | Footnote [6], plus 2 mm test pin at 150 mm |
| Linearity, wider fields | ≤1 µm (field 2, ±1.5 mm); ≤2.5 µm (field 3, ±2.5 mm) | ≤3 µm (field 2, ±10 mm) | How deviation grows off-centre | Footnote [6], plus 2 mm test pin at 150 mm |
Footnote [6] applies to both repeatability and linearity: 95% confidence interval for diameter measurements, averaging 1,024 values over 5 minutes, in a temperature-stabilised environment after a 45-minute warm-up.
The linearity footnotes matter as much as the headline value. “Z” is the product’s offset along the beam from the nominal 150 mm position. A wire that wanders ±2.5 mm in a 10 mm gauge sits in the field rated ≤2.5 µm, not ≤0.5 µm. Contact sensors have their own conversion chain to understand before trusting a number; our strain gauge explainer shows how gauge factor and bridge output turn strain into a signal.
Common mistake: Quoting the 10 nm resolution, or the ≤0.03 µm repeatability, as the gauge’s accuracy. Neither number says how far a reading sits from the true diameter.
Takeaway: Start the error budget from the linearity row for the field your product passes through, then add your own line effects.
Where do the launch numbers and the datasheet disagree?
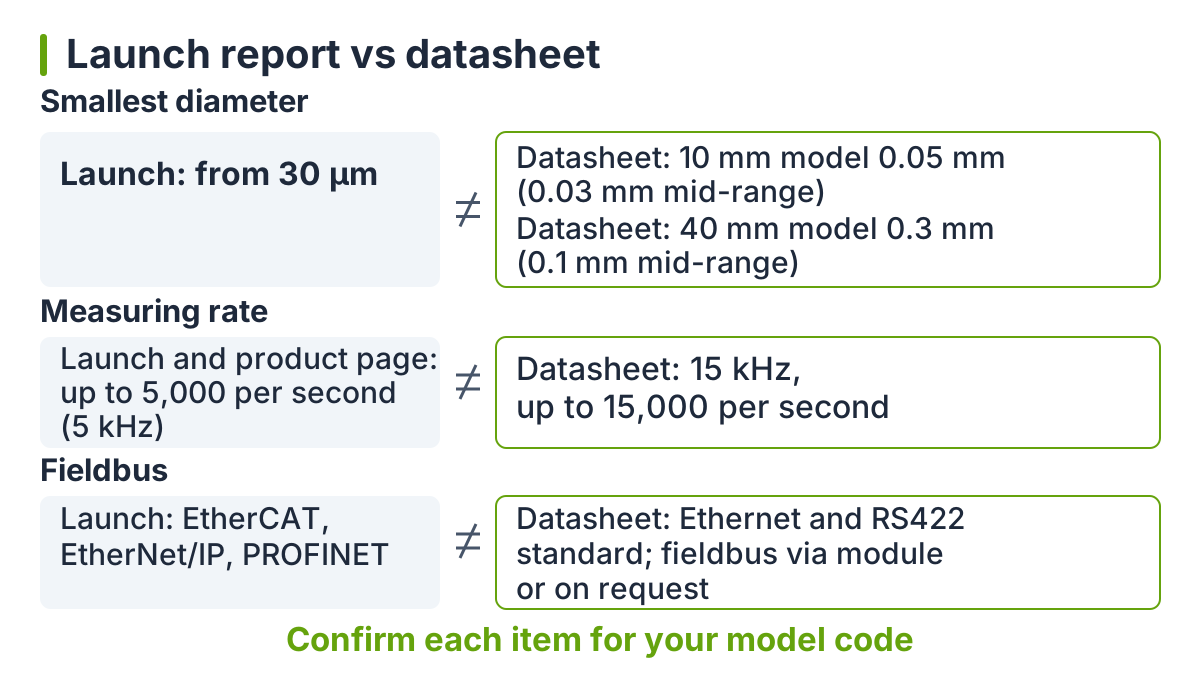
Three statements in the launch coverage need the datasheet’s qualifiers before you rely on them: the 30 µm minimum, the measuring rate, and the fieldbus interfaces.
| Item | Launch report and product page | Datasheet excerpt | What to do |
|---|---|---|---|
| Smallest diameter | “From 30 µm” | 10 mm model: 0.05 mm, or 0.03 mm at mid-range. 40 mm model: 0.3 mm, or 0.1 mm at mid-range | Treat 30 µm as a 10 mm-model, centred-part figure |
| Measuring rate with tilt correction | Up to 5,000 per second; product page says 5 kHz | 15 kHz sampling and measuring rate; text says up to 15,000 per second | Ask which rate applies to your measuring program and interface |
| Fieldbus | EtherCAT, EtherNet/IP and PROFINET listed as interfaces | Ethernet and RS422 as standard; fieldbus via an interface module or “on board” on request | Confirm the ordered model’s interface in writing |
The interface decides how the two axes reach your control system; for plant trade-offs between fieldbus, Ethernet and simpler outputs, see the interface section of our industrial IoT sensor guide.
Takeaway: Write the minimum diameter, rate and interface you need into the evaluation request and get each one answered for the exact model code.
What does the second axis add over one ODC2700?
The second axis gives you two perpendicular diameters and the centre position; Micro-Epsilon says that in synchronous mode both axes deliver values at the same time (the system also runs asynchronously). It is not the only route to tilt correction: Micro-Epsilon’s catalog says a single optoCONTROL 2700 already corrects for inclination in real time and measures the angle of the part.
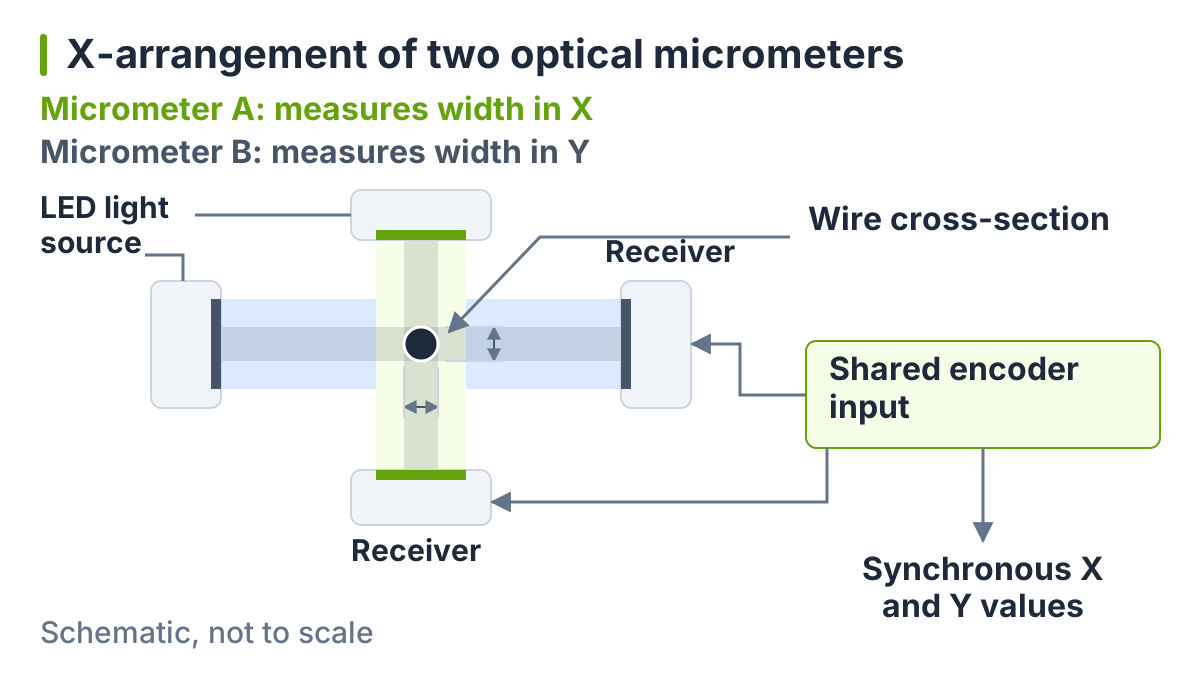
A single shadow gauge reports one projected width, so on its own it cannot show out-of-roundness at a given moment. Two perpendicular gauges report X and Y widths together, which reveals ovality when the product’s long axis lines up with one of the beams. When the oval sits at about 45° to both beams, the two readings can look alike, which is why some lines use three axes or rotate the part. The C.ODC adds synchronous acquisition and a shared encoder input, so each X and Y value can be tied to the same position along the product.
Common mistake: Buying the two-axis frame only to fix tilt error. If your product is round and one projected width is the controlled dimension, evaluate a single ODC2700 with its own inclination correction first, then check its range, conditions and error against your requirement.
Takeaway: Choose two axes when you control ovality or centre position, not just to correct tilt.
Who is affected, and how?
Quality and automation engineers measuring fine round products inline need to act; the table uses only what the manufacturer documents state.
| Reader | Impact | Basis |
|---|---|---|
| Wire drawing QC | Wires from 0.05 mm (0.03 mm at mid-range) up to 0.1 mm are below the 40 mm model’s minimum, so the datasheet points to the 10 mm model; below 0.03 mm no model is specified. The catalog’s wire-drawing example names the ODC2700-40, so confirm the model | Datasheet min. target size; catalog application page |
| Glass fibre producers | The catalog lists glass fibre from 30 µm with a single ODC2700-10; that is an application example for the single micrometer, not a C.ODC validation | Catalog application page |
| Extrusion of tubes and hoses up to 40 mm | 40 mm model, with 0.3 mm minimum and ≤1 µm central linearity | Datasheet; catalog extrusion example |
| Transparent glass or plastic parts | The vendor says the optical principle detects them; conditions are not given | Datasheet text |
| Integrators | Standard Ethernet / RS422; fieldbus by module or on request; 11–30 VDC supply | Datasheet |
If a contact method is acceptable on your line, our comparison of strain, force, displacement and elongation sensors covers LVDTs and extensometers, and the output and interface table in our industrial IoT sensor guide helps integrators plan the signal path.
Takeaway: Pick the model by your smallest diameter and pass-line wander first; the rest of the table follows from that choice.
When should you act?
Start a paper evaluation now; purchase timing depends on US availability, price and lead time, which the documents do not state.
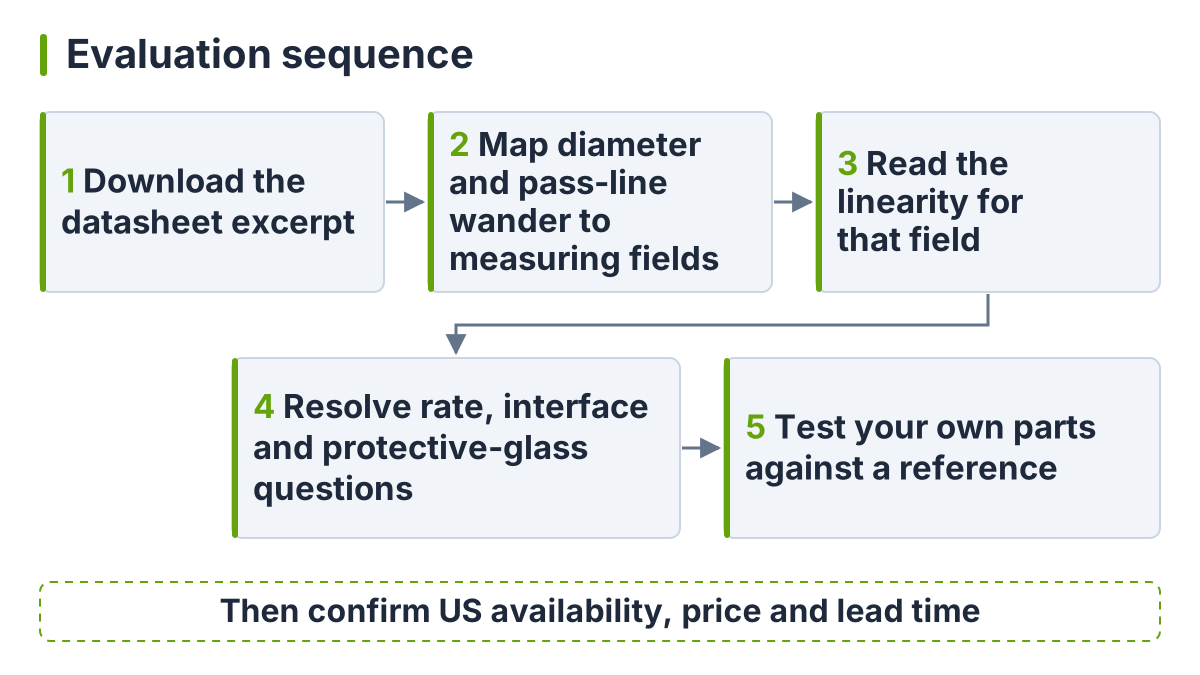
| When | Action | Status |
|---|---|---|
| Now | Download the datasheet excerpt and setup files from the product page | Available, read 7 Oct 2026 |
| Before shortlisting | Map your diameter range and pass-line wander to the linearity fields: 1–3 for the 10 mm model, 1–2 for the 40 mm model | Your data |
| Before a trial | Get the rate, interface and protective-glass questions answered for the model code | Needs checking with the supplier |
| Before ordering | Confirm US availability, price and lead time with the regional representative | Not published |
Micro-Epsilon’s US product page lists regional sales representatives by state, which tells you whom to ask, not what they stock.
Takeaway: Run the paper evaluation now and leave purchase timing until availability is confirmed in writing.
What is still uncertain?
Six items remain open after reading the manufacturer documents. Each has an owner who can close it.
| Open item | Who can confirm | What to ask for |
|---|---|---|
| Which measuring rate applies: 5 kHz or 15 kHz | Micro-Epsilon applications team | Rate for your measuring program with tilt correction on |
| Linearity with the protective glass (PG / PGA) fitted | Micro-Epsilon | Statement or calibration note per model code |
| Performance on your product at line speed and vibration | Your own trial | Sample measurements against a reference gauge |
| Limits for transparent parts | Micro-Epsilon | Application note or trial on your material |
| Which model suits wire below 0.1 mm, given the catalog example names the 40 mm sensor | Micro-Epsilon applications team | Model recommendation against the datasheet minimum |
| US availability, price, lead time, first sale date | US regional representative | Written offer with model code |
No independent test of the C.ODC was found in our searches on 7 October 2026.
Takeaway: Close the rate and protective-glass questions first, because they change which datasheet numbers apply to you.
When does this not apply?
The datasheet reading above does not carry over in these cases:
- Your part is non-round, tilted beyond what the correction covers, or measured with a contour program; the 2 mm test-pin diameter figures do not transfer directly, so validate those cases separately and confirm the inclination-correction range.
- Your line runs outside 0–50 °C, or without warm-up and temperature control; the footnote [6] conditions are not met.
- You need certified traceable measurement for acceptance; manufacturer figures are not a calibration certificate.
- You are comparing against other brands; this page does not rank products.
Takeaway: Where your conditions differ from the datasheet’s, confirm performance with your own trial data.
Our reading
The C.ODC packages two existing micrometers into an aligned frame, and its datasheet is detailed once you find it. The press version dropped the linearity rows and the per-model limits, and it repeats a 5,000-per-second figure that the datasheet does not match. The useful work is therefore to map your diameter and pass-line wander onto the footnoted fields and get the contradictions answered. Teams weighing camera-based inspection for the same line can follow MVTec’s tooling plans in our AI Vision Solver note; other instrument explainers are under test and measurement and sensors and DAQ.
Takeaway: Treat the launch report as a pointer to the datasheet, and evaluate from the datasheet’s conditions.
Related reading
Pick the next read by where your evaluation goes.
- Strain gauge basics — See how gauge factor and bridge output convert strain into a signal in a contact sensor.
- Industrial IoT sensors — Check which output and interface your control system can take.
- Strain gauge vs load cell — Compare contact sensors if a non-contact gauge is not required.
Takeaway: Read the interface guide next if the gauge must report to a PLC.
Method and update log
Compiled on 7 October 2026 from Micro-Epsilon’s US product page, its datasheet excerpt and catalog PDFs, and the Instrumentation Monthly report, which rewrites the vendor release and counts as one source. Figures are manufacturer specifications with the conditions printed in their footnotes; we have not tested the product. Last reviewed 7 October 2026.